Investment Psychology
Dingyi Lai / December 2017
Introduction
In securities trading, the emotions and psychology of traders will have an impact on trading behavior. However, in the previous research on investment psychology, most of the data in the literature were taken from the data of TSE (Taiwan Stock Exchange) from 1995 to 1999, using the rate of return as a measure of investment performance and the turnover rate as investment sentiment (overconfidence). But there is little literature on sentiment distillation of stock prices.
The anxiety that pervades the market can lead to massive stock selling, price crashes, and massive losses, as we’ve seen many times. Anxiety is an instinctive self-defense reaction of humans in the face of uncertainty, and all traders hope to capture this tension and fear by observing and studying market behavior, trading patterns, market spreads, or order flow.
The main problem is that we are well aware of the importance of human behavior in trading, but we cannot directly observe it from stock prices. Hence, is there a way to break down the sentiment part from the trade-related factors? With this motivation, I conduct a quantitative study. Codes without accessing to details are presented in this repo
Methodology: PCA
Principal component analysis (PCA) is considered to be one of the most valuable methods in applied linear algebra. It provides a simple, non-parametric method for extracting relevant information from messy data.
Suppose we observe the daily price changes of \(p\) stocks over the past \(n\) days. We get matrix \(X\). Let the mean of the random vector \(X\) be \(\mu\), covariance matrix be \(\sum\). Make a linear change in \(X\), taking into account linear combinations of the original variables (principal components are uncorrelated linear combinations \(Z_1, Z_2,...,Z_p\)):
\(\begin{cases} Z_1={\mu}_{11}\cdot X_1+{\mu}_{21}\cdot X_2+...+{\mu}_{1p}\cdot X_p \\ Z_2={\mu}_{21}\cdot X_1+{\mu}_{22}\cdot X_2+...+{\mu}_{2p}\cdot X_p \\ ……, \\ Z_p={\mu}_{p1}\cdot X_1+{\mu}_{p2}\cdot X_2+...+{\mu}_{pp}\cdot X_p \end{cases}\) where \(Z_1\) is the maximum of variance among the linear combinations \(X_1, X_2 ,...,X_p\), \(Z_2\) is the maximum of variance among the linear combinationsis that is unrelated with \(Z_1\), …, \(Z_p\) is the maximum of variance among the linear combinations that is unrelated with \(Z_1, Z_2,...,Z_{p-1}\).
We aim to build a simplified quantitative model to detect anxiety in trading markets via PCA. We consider the Taiwan Index 50, which consists of 51 Taiwanese stocks consisting of 20 tech stocks, 17 traditional industry stocks, and 14 financial stocks. The 2008 financial crisis spread panic over the stock market. In order to strip the panic factor from the stock price, we construct the covariance and its eigenvalues of the Taiwan Index 50 later. But firstly, we conduct exploratory analysis and descriptive statistics.
Exploratory Analysis and Descriptive Statistics
- Data import and cleaning of Taiwan index 50 component
- Descriptive statistics for the 20 stocks after filtering
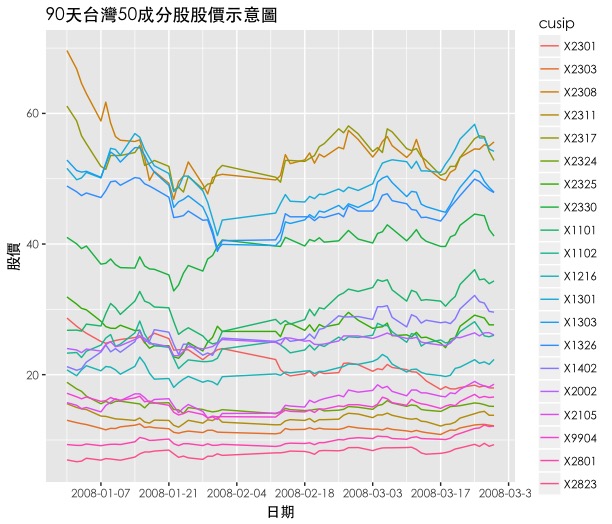
- Randomly select a day, such as 2007/12/31, extract the historical price data of all 20 stocks in the following 90 days and save it to Z.
- date_breaks = “2 week”; x=”Date”; y=”Stock Price”; title=”90-day chart of 50 constituents in Taiwan”

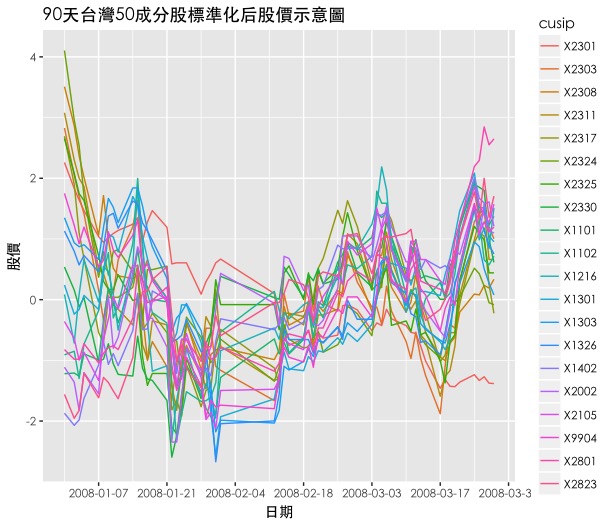
- To make time comparable, X is further normalized
- Descriptive Statistical Chart Normalized for 20 Stocks
- Randomly select a day, such as 2007/12/31, extract the historical price data of all 20 stocks in the following 90 days and save it to Z.
- date_breaks = “2 week”; x=”Date”; y=”Stock Price”; title=”90-day chart of 50 constituents in Taiwan”

- Construct a matrix with time as rows and 20 stocks as columns, which is convenient for drawing the covariance map of these 20 stocks over a period of time
- Descriptive Statistics Plot of 20 Stock Covariance Matrix
- The covariance matrix diagonal tells us that for normalized time series, their covariance is equal to 1
- x=”20 stocks”; y=”20 stocks”; title=”Covariance plot of 20 constituents after filtering”

- Descriptive Statistics Plots for Principal Component Analysis
- The covariance matrix diagonal tells us that for normalized time series, their covariance is equal to 1
- x=”20 stocks”; y=”20 stocks”; title=”Covariance plot of 20 constituents after filtering”

- It shows that at least 19 out of 20 eigenvalues are negative, which indicates that Taiwan’s stock market had largely fallen over the past 90 days. It supports traders to possess short positions in these stocks. Remarkably, the first principal component does not represent “price momentum” per se, it represents a latent variable commonly found in stock dynamics instead, i.e. potential artefacts in trading. The image above also gives an additional piece of information. All eigenvalues in the first principal component are significantly suppressed, and the eigenvalues of the remaining four principal components appear rather random. By inspection, this feature persisted for many years in our sample data. Therefore, we can focus our observations on the first principal component.
- Grab the historical stock price of Taiwan Index 50 from yahoo server
Model Construction
- Construct a model for the proportion of negative emotions For a time period \([d_1 , d_2]\), Select every the day after t day in this period, for instance, in \([d_1 , d_2]\), we take out the first principle component of these 20 stocks in this period, and calculate the percentage of the number of stocks whose eigenvalues are negative, which gives us a ratio of negative emotion. So in \([d_1 , d_2]\), we will have \(d_2 - d_1+1\) ratio of negative emotion.
- Select the stock data from 2007/12/31 to 2011/12/31 and run the model
- Construct a function to grab the Taiwan 50 index for a period of time
- Construct a 30-day moving average model of negative sentiment ratio
- date_breaks = “6 month”; x=”Date”; y=”Index Price”; title=”30-day MA of index price”

- Comparison of negative sentiment ratios of constituents in Taiwan Index 50
- Construct a function that can compare multiple pictures in one interface
- Compare the two pictures side by side. Time period: from 2007-12-31 to 2011-12-31
- date_breaks = “6 month”; x=”Date”; y=”Negative Sentiment Ratio”; title=”30-day MA of negative sentiment ratio”

- Build the core model, that is, when the proportion of negative numbers in the first principal component increases for 5 consecutive days, we confirm anxiety. Mark anxiety on the historical stock price chart of the Taiwan Index 50.
- Construct a function that can compare multiple pictures in one interface
- Compare the two pictures side by side. Time period: from 2007-12-31 to 2011-12-31
- date_breaks = “6 month”; x=”Date”; y=”Anxiety Ratio”; title=”30-day MA of anxiety”

- Every time a stock has a big turning point, it is easy to generate the anxiety mentioned earlier. Because the definition of anxiety is based on previous studies. But with our model, we prefer to define this emotion as “dispute energy”. We can observe such controversial energy when the momentum effect of a stock is interrupted.
Conclusion
It led us into a potential latent variable: “dispute energy”. First, it doesn’t predict the future, but only comes with time. What it brings, however, is a re-examination of past market dynamics and the psychological movement of traders. The essence of stock price is a game of traders’ different expectations for the future. Therefore, such a model of “dispute energy” might help us judge when the momentum effect has a trace of disappearance, thus it is hoped, better to buy low and sell high.